When we talk to knitters, many mention that they don’t like charts or are nervous of patterns that include them. Often this is because knitters haven’t ever been shown how to work from charts, so we thought we’d provide an introduction.
Charts are simply another way of providing knitting instructions and if they are well drawn they should to some extent be a diagram of how your knitting should look.
The most straightforward charts to understand are those for colourwork.
Each square on the chart represents a stitch. You could think of putting your knitting needle below the chart and matching the stitches on your needle to the stitches on the chart.
Right side rows are worked from right to left, this is why the right hand column is labelled 1. If you think about matching your knitting to the chart, if you are working a right side row the tip of your needle would be at the right hand side of the chart. A wrong side row would be worked from left to right because you are working back along your stitches.
The key to the chart tells you the right side rows are knitted and the wrong side ones are purled. It also shows you what colour yarn each stitch is worked in. So your knitting should look like the chart picture as you progress.
This chart also has a red outlined box. This shows you the set of stitches to repeat across the row for the pattern to right a across your work. For example a in a garment with five flowers across it, row one might be written out as “K2A (k5A, k2B, k5A, k2B, k6A) five times, k1A” – A and B refer to the yarn colours. All the chart is doing is showing you that in a picture.
Cable charts
Cable charts can be a good example of showing how your work should look as well. The symbols for cables here show which direction each cable should slope.
It is important to read both the key to any chart and the abbreviations carefully. This will tell you how many stitches are used in a cable and what to do.
For example here we have a symbol using three squares which the key says is Tw3B. The abbreviations section would tell you that this means “slip next 1 st on to cable needle and hold to back, k2, p1 from cable needle” – this makes cable that slopes to the right and if you look at the symbol it has a right leaning slope. The dot in the symbol is the purl stitch and you can see that it is worked after the knit stitches.
Texture and lace
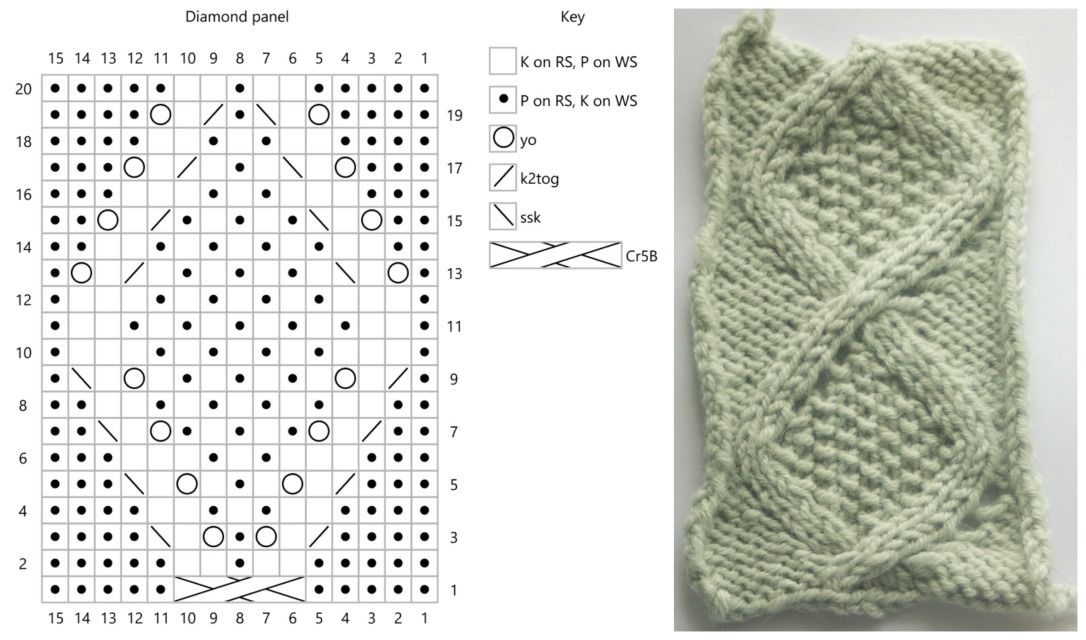
Charts for texture and lace should be approached in just the same way, understanding what each symbol means and working one stitch at a time.
You may find that as you work with charts for a while you will be able to look at a piece of knitting and see more clearly what is happening with the pattern because you are more used to reading the stitches from a picture.
Top tips
Of course looking at the charts at first might still be daunting so we asked our social media followers for their advice.
Most of this focused on being able to see clearly which row you are working on the chart. The top recommendations were to use washi tape, post-it-notes or a chart board with magnetic strips to outline the row you are working. That way you won’t be distracted by other rows.
Another useful suggestion is to photocopy the chart and use coloured pencils or highlighter pens to mark different stitches in different colours.
If your chart involves repeats, put a stitch marker or a loop of contrasting yarn on the needles at the start of the group of stitches for each repeat.
What are your top tips for working from charts, please tell us in the comments.


Thank you very much for the good advice. In the middle of a jumper using charts at the moment.
LikeLike